In-built analysis in card sorts
Card Sorts by UserBit comes with built-in analysis tools that help you interpret your study results and identify meaningful patterns. Let’s take a closer look at how each one works.
Understanding the Frequency Matrix
The Frequency Matrix shows how often cards were grouped together by participants during a Card Sort study.
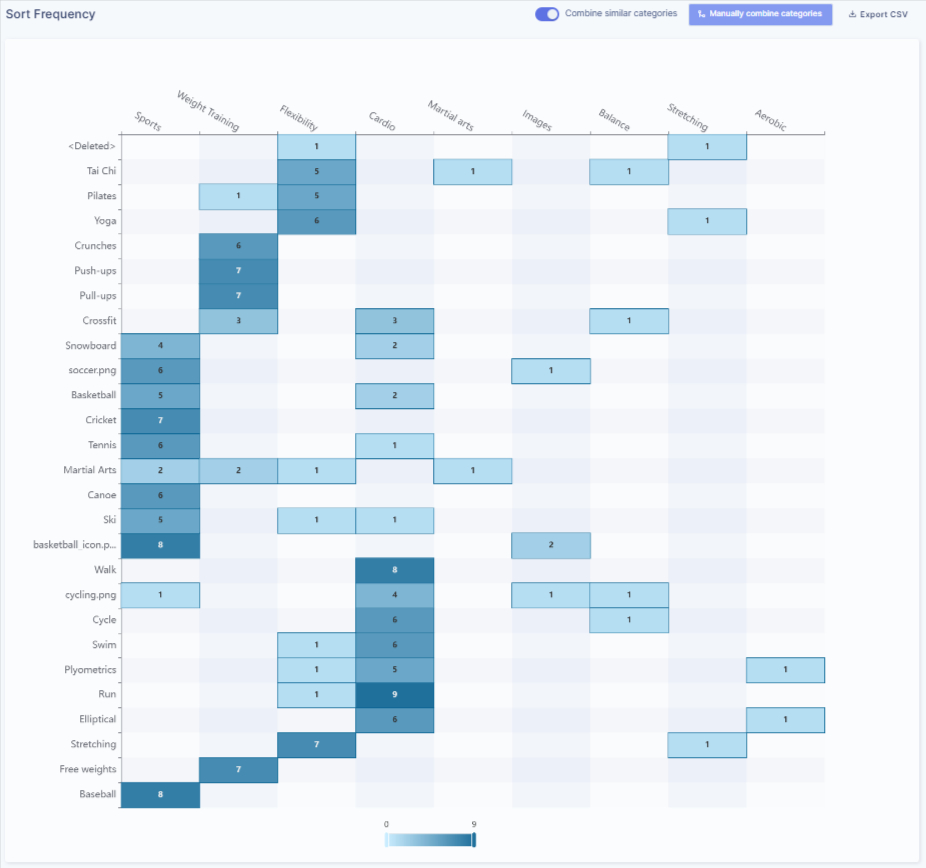
In this view, cards are listed along one axis and categories along the other. Each cell represents the number of times a specific card was placed into a specific category. The higher the number, the more frequently participants associated that card with that category.
The color intensity helps you scan patterns quickly. Darker cells indicate stronger agreement among participants, while lighter cells show weaker or less consistent groupings. This makes it easier to spot dominant associations at a glance without reading every value.
You can use the Frequency Matrix to understand:
-
which categories feel most “obvious” to participants
-
where cards were consistently placed
-
where confusion or overlap exists across categories
Understanding the Similarity Matrix
The Similarity Matrix shows how closely cards are related to each other based on participant behavior.
Unlike the Frequency Matrix, which looks at cards and categories, the Similarity Matrix compares cards directly with other cards. Each cell represents the percentage of participants who placed two cards together in the same category.
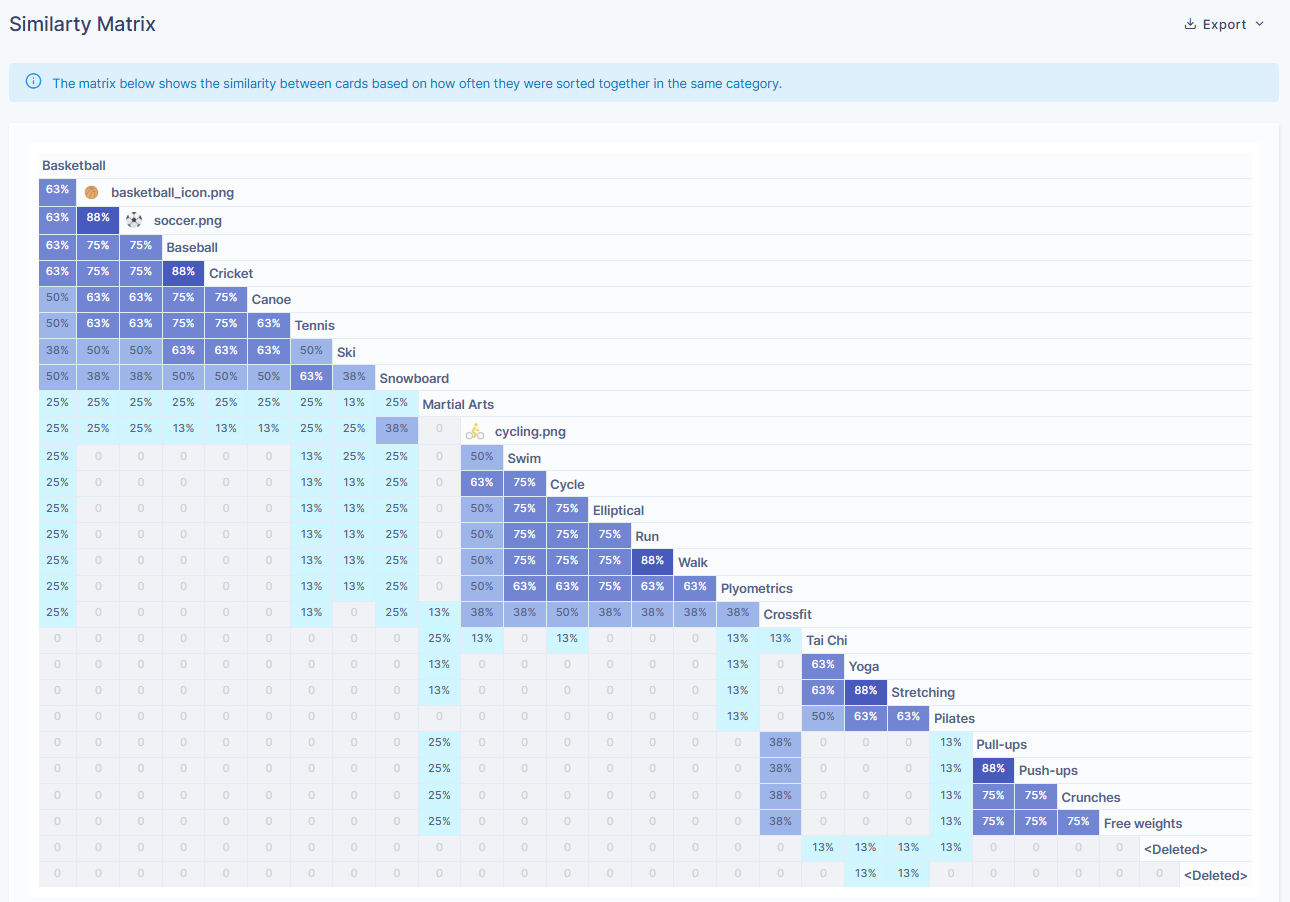
Higher percentages indicate a stronger relationship. For example, if two cards show a similarity of 75%, it means most participants consistently grouped those cards together. Lower values suggest weaker or less consistent associations.
Color intensity helps highlight these relationships visually. Darker cells represent stronger similarity, making it easier to identify clusters of cards that participants repeatedly associated with each other.
You can use the Similarity Matrix to:
-
Identify tightly related card groups
-
Spot natural clusters that may form sections or navigation groups
-
Understand which cards users strongly expect to live together
Understanding Categories
The Categories view shows how participants grouped cards under category names during the Card Sort study. Inside each category, you’ll see the cards that were placed there, along with two values: the number of times a card appeared in that category and the percentage of participants who placed it there.
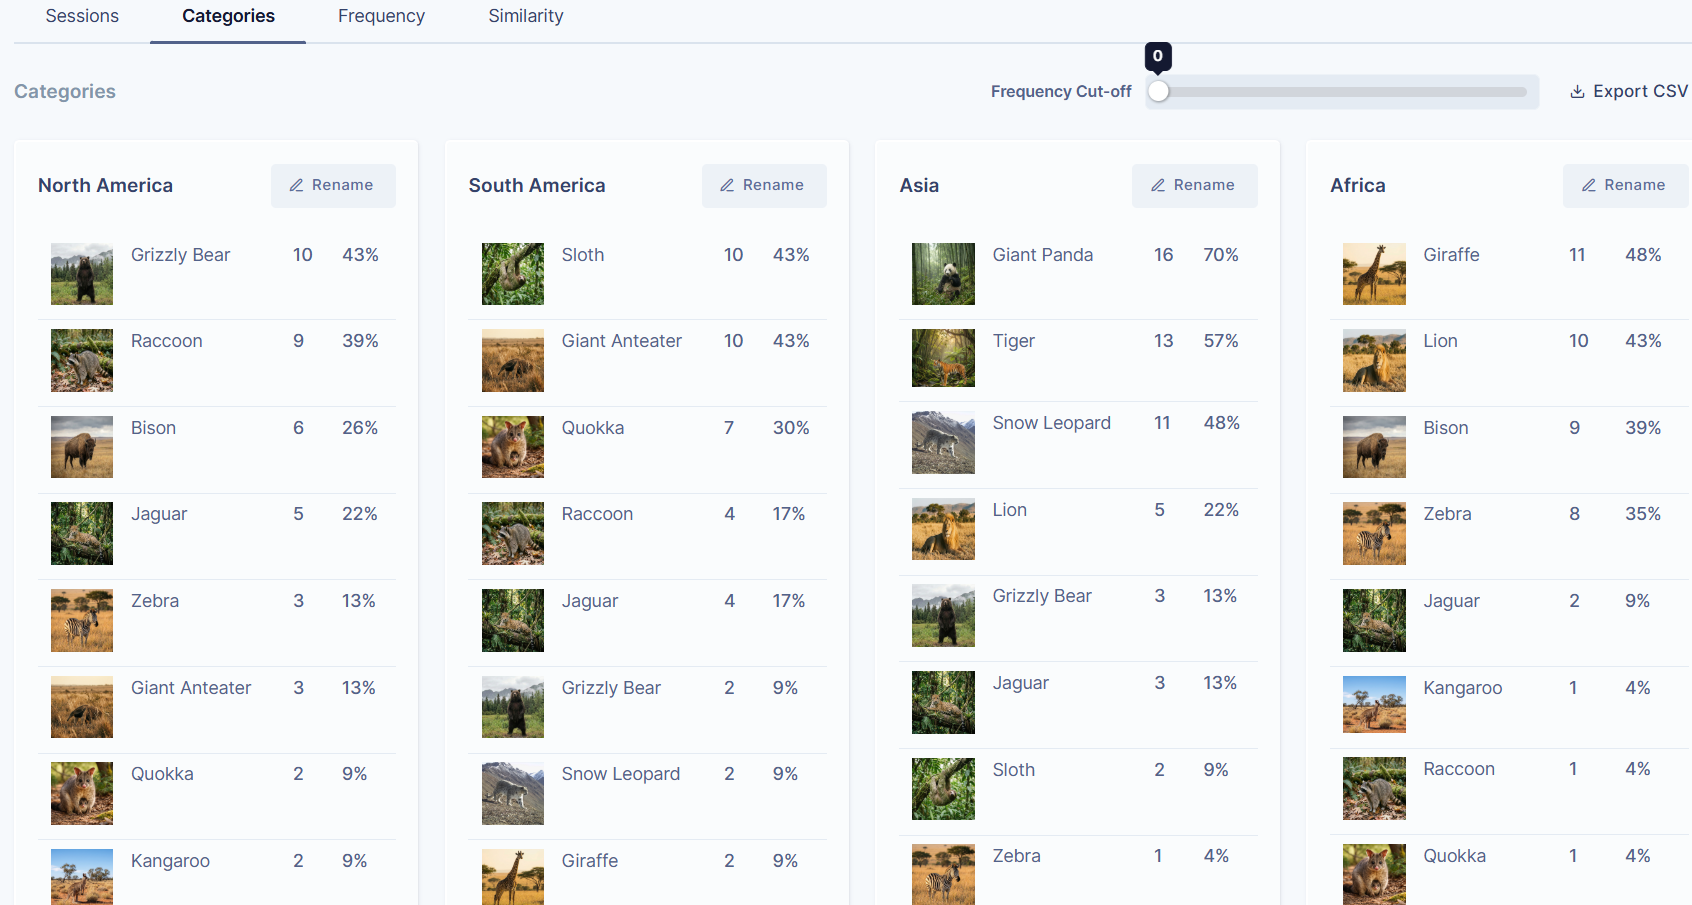
Cards listed at the top of a category are the most consistently grouped items, while cards lower down were placed there less frequently. This helps you understand which items feel like strong fits and which ones are more uncertain or loosely associated.
You can use the Categories view to:
-
Review how participants labeled groups
-
Identify common naming patterns
-
See which cards strongly belong to a category versus those that appear sporadically
Frequency Cut-off
The Frequency Cut-off control lets you filter categories based on how often cards were placed together.
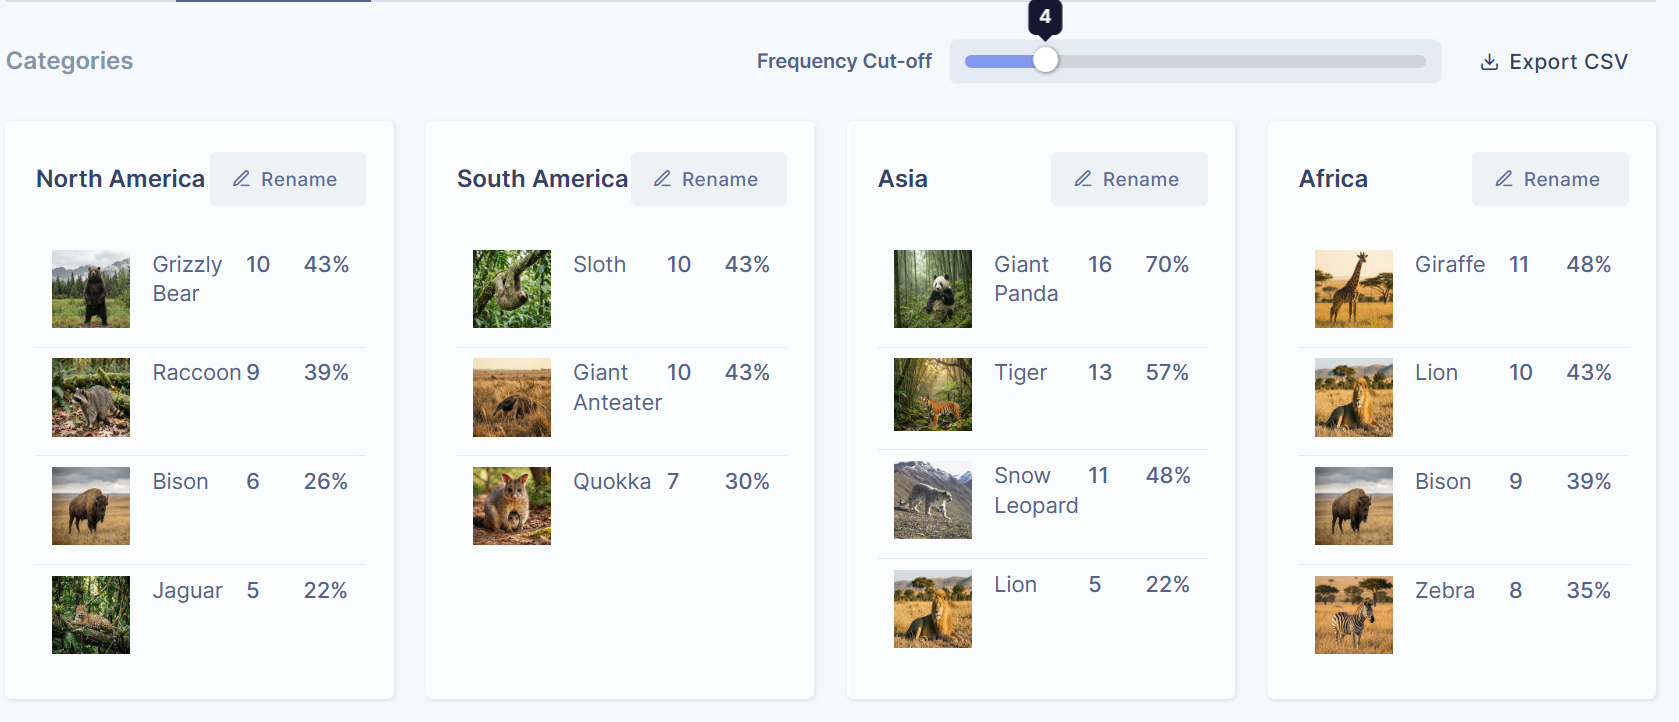
When you increase the cut-off value (for example, to 4), cards that were placed into a category four times or fewer are hidden. This helps you focus on the strongest and most consistent groupings, reducing visual noise from outliers.
Lowering the cut-off brings back less frequent placements, which can be useful when you want to explore edge cases or understand areas of confusion.
The Frequency Cut-off is especially helpful when moving from exploration to decision-making, as it helps surface the most reliable patterns in participant behaviour.