Analyzing surveys
Analyzing large surveys is always a daunting task. You need to somehow aggregate survey responses, then try and collect response frequencies so that you can create an easy to digest chart, and if somehow you do manage to do all that, you still have no easy way to segment data by participant demographics, etc.
Fortunately, UserBit gives you a number of powerful tools to make extracting meaning out of your surveys much easier. In this post, we'll go over the various features that can help you quickly analyze your surveys. Let's jump straight into it!
Automatically Generated Charts
For a really quick (and simplistic) analysis of survey responses, you can leverage the automatically generated charts for each survey question. When you click on one of the survey questions, you can view all the corresponding responses. At the top of this cross-analysis page, UserBit automatically generates a few useful charts - bar chart and word-cloud.
Comprehensive Analysis via Tagging
The real power of analysis on UserBit comes from tags. Tagging automatically generates frequency and correlation charts on UserBit which are immensely useful in visualizing trends and themes. Let's look at how we can tag our survey data.
Just like interview responses on UserBit, it is important to be able to tag survey participants and survey responses separately for a more fine tuned analysis.
Survey participants are ideally tagged with demographic attributes like age-group, team-size, role, etc. Participant tagging comes in very handy for analyzing data, which we will get into, shortly.
Survey responses on the other hand, are typically tagged with behavioral tags like frustration type, feature request, preferences, etc.
Tagging Survey Participants
There are two ways to tag survey participants with segment tags:
- Manually tag participants - the most straightforward way of tagging participants is doing it manually. However, this method is too cumbersome when the number of participants is high.
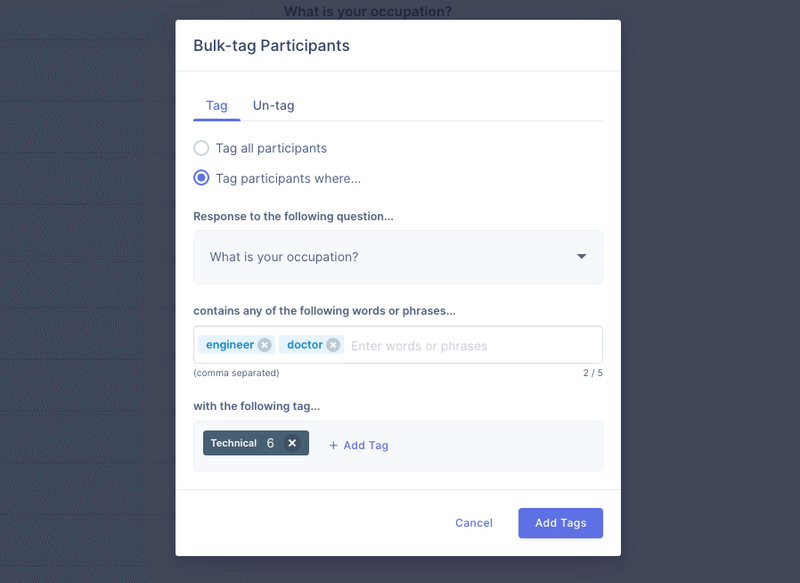
- Auto-tag participants based on a given response - for large number of participants, this is the recommended way of adding segment tags to the participants.
Tagging Survey Responses
There are three ways of tagging survey responses:
- Manually tag survey responses - survey responses can be tagged manually by using the tagger bar on top of each response. For smaller surveys, this might work just fine but as you can imagine, larger surveys can easily contain thousands of responses and this method isn't very scalable.
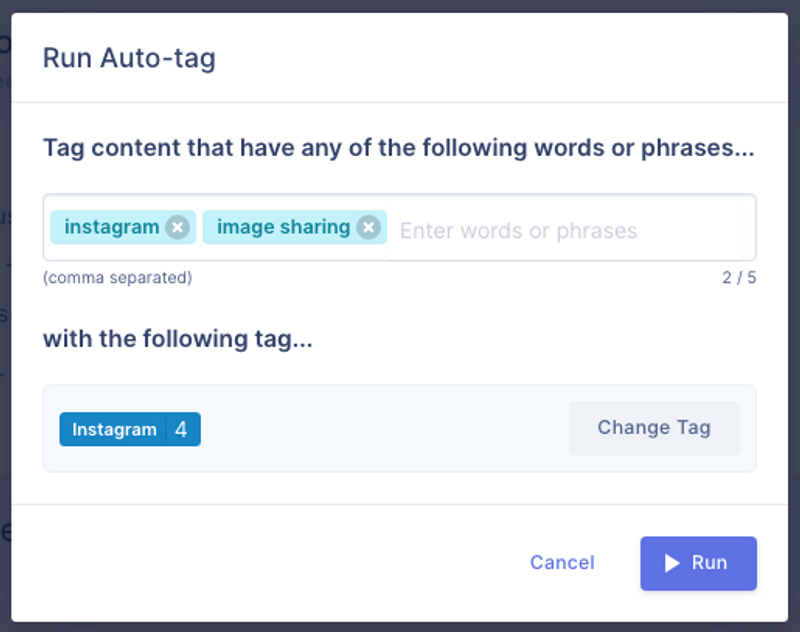
- Auto-tag survey response for each question - One quick way to save time tagging survey responses is to use UserBit's local auto-tag feature. Click on any survey question to access the "Auto-tag" button. This allows you to tag all responses with a given tag based on keywords or phrases found in the responses.
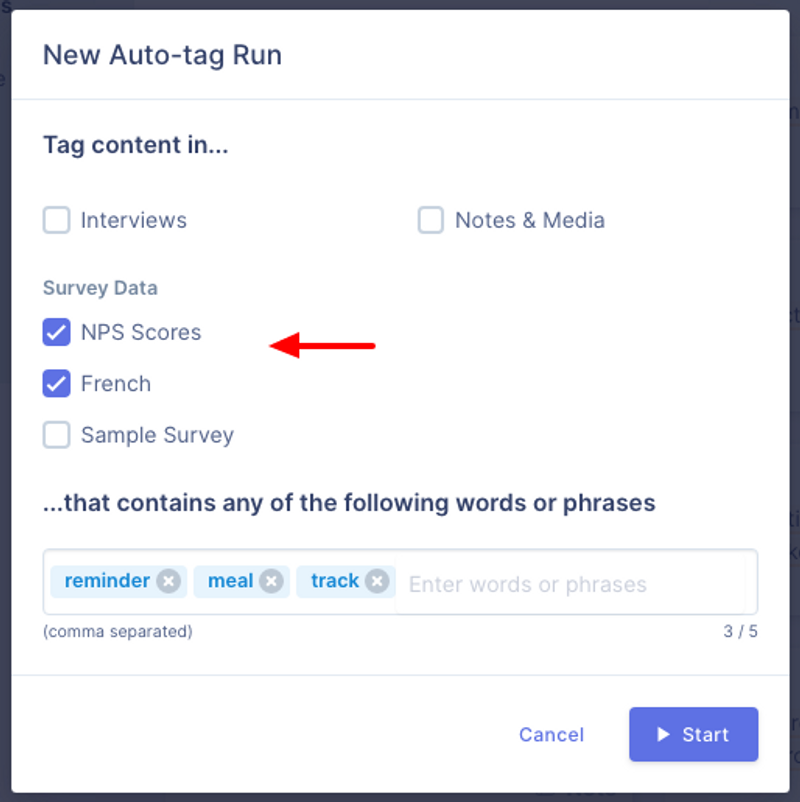
- Auto-tag survey responses of multiple surveys - want to save even more time? If you want to tag all survey responses across multiple surveys at once, you can use the "auto-tag entire project" feature. You can access this feature from the tag page of the tag that you intend to use.
Analyzing Tagged Data
The Charts section within Analytics allows you to quickly visualize frequency of tags within tag categories. You can also slice your data by using combinations of segment tag filters:
Learn more about analyzing your tagged data here.
Analyzing Tag Correlations
Equally important is to be able to analyze tag correlations. For this you can use the tag correlation tab in the analytics dashboard. These are incredibly useful for figuring out relationships between tags. There are three categories of tag correlation that you can leverage on UserBit:
- Highlight tag correlation with user segments - How many times were the tags used within a given user segment?
- Correlation between two highlight tag categories - How many times were the tags used together in an interview response, survey response or in notes?
- Correlation between two segment tag categories - How many of our participants belong to the same combination of segments?
Learn more about correlation analysis here.
When used together, these features can help you quickly analyze and synthesize your survey data. Not only will it help you save a ton of time but also allow you to bubble up important themes and patterns within your surveys.