Analyzing interview responses & notes
A fundamental problem with mainstream methods (affinity / empathy mapping) of synthesizing research data is that they don't scale. As our data grows into 100s of interviews and posts, affinity diagrams and maps often become incomprehensible. In this post, we will go through how we can use an alternate method - tags for a scalable analysis of our research data on UserBit.
Tags
-
Segment Tags — tags that usually represent demographic attributes and can be applied to:
- stakeholders
- participants
- survey participants
-
Highlight Tags — tags that usually represent behavioral attributes and can be applied to:
- Highlighted text in user/stakeholder responses
- Highlighted text in notes and media section
- Survey responses
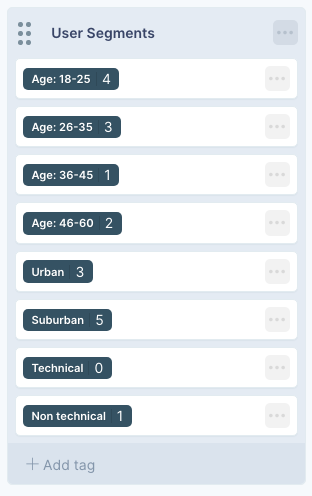
Segment Tags
Segment tags are simply tags that help categorize our users. They could be any set of relevant attributes that help classify our user-base - age group buckets, team sizes, role types, etc.
A way to come up with segment tags is to first think about what kind of questions you might want to ask of your data. If your question is something like:
What are the biggest pain points of our users that are over the age of 50?
Here, you would want to have segment tags with age range buckets and tag your users/notes accordingly.
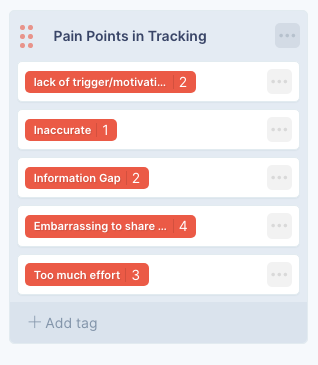
Highlight Tags
Highlight tags are used to mark relevant parts of user responses, feedback or observations. In order to figure out what tags should be created in a project, you should once again think about the kind of questions you want answered. Let's consider the same question as above:
What are the biggest pain points of our users that are over the age of 50?
If you want a ranking of pain points, each pain point should be its own tag so you can keep track of them individually.
You can either create a list of tags before hand for information you expect to find in your data, or can create tags on the fly when you are going through the data.
Tagging Responses and Notes
Going through and tagging our interview responses or notes on UserBit is as easy as it gets.
- Navigate to the user interview or research note that you want to code
- Add segment tags to the top section
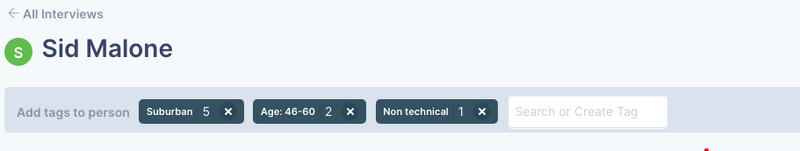
- Highlight and add tags to any relevant text in responses and notes.
- If you encounter important information that you haven't already created a tag for, you can simply create one on the fly. The new tag will appear under ungrouped tags. You can organize them at anytime by going to the tags section.
Auto-tagging Based on Keywords or Phrases
One of the most powerful features on UserBit when it comes to tagging qualitative data, is the auto-tag feature. Both interview responses and research notes can be bulk-tagged based on keywords or phrases.
You can auto-tag individual notes, or responses of a question, or better yet, you can run auto-tag across your entire project.
Analyzing Data After Tagging is Complete
In the charts section, you can now quickly see patterns and priorities. On wakeup the charts show the frequency analysis in each highlight tag group across the entire project. For example, you can immediately see the features that users are most requesting within your project.
This is where segment tags also play a vital role. What if we wanted to see
the top feature requests of users who're in the Age bucket of 26 - 30?
All we have to do, is filter the analytics by the relevant segment tag:
We can also use a combination of segment tags to fine-tune the results even further.