
User Journey Maps and Their Importance in UX Research
A user journey map is a visualization tool that captures the process a person undergoes to achieve a specific goal, from start to finish.
It visualizes not just their actions, but also their thoughts, feelings, and emotions throughout their experience. This map becomes a narrative, highlighting high-level phases composed of user actions, thoughts, and emotions.
For UX researchers, the value of well-made journey maps lies in the ability to quickly identify the steps in users’ path where they are delighted or frustrated. Thus, providing UX professionals with design opportunities to enhance the users’ experience with their products,
As with any concept, an example makes things a lot easier to understand. So, let's go through a simple example of a hypothetical user named Jane and her headphone-buying journey.
Visualizing a user journey map: example
A user journey map often looks like a flowchart or storyboard that showcases different stages of the user's experience. Following is a step-by-step breakdown of Jane’s journey:
1. Awareness – Jane realizes her headphones have poor sound quality.
Emotion: Frustration, desire for better sound.
Pain Point: Discomfort, declining quality.
2. Consideration – She researches noise-canceling headphones online.
Emotion: Overwhelmed by choices, excited for an upgrade.
Touchpoints: Reviews, brand websites, forums.
3. Decision – Jane buys a top-rated model from the brand’s website.
Emotion: Confidence, anticipation.
Pain Point: Hidden fees or checkout friction (but Jane had a smooth experience).
4. Post-Purchase – She loves the sound quality after unboxing.
Emotion: Satisfaction, validation.
Opportunity: Easy setup guides, warranty perks.
5. Advocacy – She leaves a positive review online.
Emotion: Wants to help others.
Pain Point: Complex review submission.
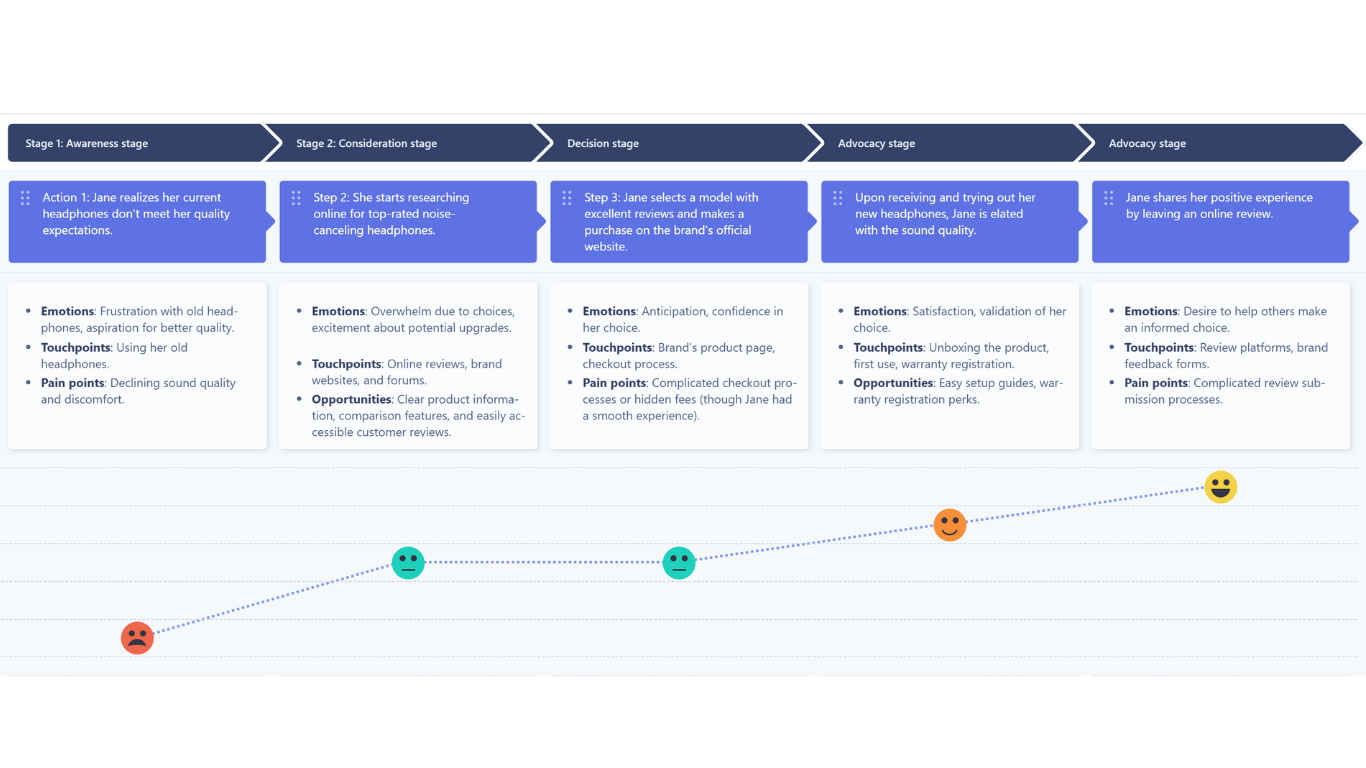
This breakdown showcases the essential elements of a user journey map, including stages, emotions, touchpoints, pain points, and opportunities.
You could also enrich the map with graphics, icons, and possibly even user quotes, giving designers and businesses a holistic view of the user experience.
User flows vs. user journey maps
Two tools often used in UX research are user flows and the user journey maps we mentioned earlier. Though they sound similar, they serve distinct purposes:
User flows
Good user flow diagrams are highly detailed representations of how a system reacts to user actions. In a user flow diagram you can expect to see both:
-
The sequence of steps a user follows to achieve a specific goal within a product or service
-
The possible states and outputs from the system in response to the actions taken by the user.
It's a focused and detailed diagram that can lead to a wireframe or prototype, showing the exact steps required for tasks like signing up for an account or purchasing a product.
User journey map
A user journey map provides a broader perspective. It's a holistic representation of a user's experience with a product or service, from the initial interaction to the end goal.
A user journey map goes deeper into the user's emotions, mental model, and expectations at each phase, highlighting pain points and opportunities for improvement.
With this map, the emphasis is on the user's feelings and perceptions, providing valuable insights for user-centered design.
Customer journey map vs a user journey map
UX professionals should understand the nuanced distinctions between commonly used terms: customer journey maps and user journey maps.
At a fundamental level, both tools aim to visualize the process a person undergoes to accomplish a goal. But who are we referencing when we say "person”?
Customer journey map
A customer journey map focuses primarily on individuals who are or will be customers – people who buy or intend to buy a product or service. It charts their interactions, emotions, and decisions leading up to and following a purchase.
This map might reveal pain points in the buying process or highlight where stakeholders can refine the user experience.
User journey map
While all customers are users, not all users are customers. This term takes into account a broader spectrum, including end users who may interact with a product without necessarily making a purchase.
For instance, in a business-to-business product, the end users might be employees who use software, but aren't the ones who bought it. This map focuses on the user's experience, expectations, and challenges they face when navigating a product or service.
How can UserBit enhance your user journey mapping process?
Journey Maps by UserBit is a comprehensive UX journey mapping tool that offers a range of tools tailored to help UX professionals refine and optimize their user journey mapping:
Repository insights

One of the most powerful features of UserBit's journey mapping module is the ability to add your insights directly from the research repository. This functionality allows you to seamlessly provide evidence supporting your decisions as you create your user journey maps and ensures that your roadmap is aligned accurately with your research findings.
Storyboarding

If you have mockups or screenshots of existing screens that correspond to the steps of the journey, UserBit allows you to easily upload them to your journey map using the storyboard lane. This feature ensures that your team members and stakeholders always have the full context around the actions of your users' journey.
Emotional graphs

By visualizing your customer's emotions at every step, you can quickly identify where they're delighted and where they're frustrated. These indicators allow you to quickly identify design opportunities to help improve your users' journeys.
Phases and action steps
With UserBit, you can define high-level phases spanning over multiple actions. Rich text formatting allows you to add detailed descriptions, ensuring that all stakeholders have a clear mental model of the user's journey.
While you plan and design, remember to keep feedback loops open. In addition to journey mapping, engaging in focus groups or employing usability heuristics can also provide valuable insights.
As you go through iterations, consider crafting personas to maintain a user-centric approach, making sure that every feature, signifier, or affordance added caters to the end users' needs and reduces any design debt.
In essence, the journey mapping process, bolstered by platforms like UserBit, can become a foundational tool in crafting experiences that resonate deeply with users.
